Rich Transcripts For political Science students at UBC
Background
Once upon a time a Political Science professor thought about transcripts and wondered if students could be given a better summary of their learning experiences. Those transcripts had the official stamp of the institution, some rather indecipherable, over-abbreviated course names, and grades – and nothing more. Not a great parting gift for students who had worked so hard, developed lots of skills, and spent so much money in their undergraduate career. It turns out that quite a few people who think progressively about higher education have been saying this for years; students need a better record of their learning that will help them articulate their many skills as they move into careers.
Fortunately for that professor, one of the authors of this piece, it was around this same time that the Faculty of Arts at UBC-Vancouver was taking first steps into defining program learning outcomes and building a datamart including enrollment and course information. From another angle, the Careers and Co-op office was looking for more tools to help students articulate the skills they develop in their BA degrees. So the time seemed right to propose a pilot project: the Course Characteristics Census (C3). The idea was to inventory courses to find our how the instructor had designed the learning and what students were being asked to do in the course. Among the many benefits, we imagined that the course data could be aggregated by student to summarize the student’s learning experiences, academic output, and skill development.
Around the world, many people have had the same sorts of thoughts about the impoverished traditional transcript. A 2017 report from the Higher Education Quality Council of Ontario, Canada reported, for example, that the “Current credential and accreditation system does not serve students well.” Some projects have been launched to get transcripts to represent students’ co- and extra-curricular exeperiences, attaching to the standard transcript some electronically-provisioned add-on that presents students’ activities outside their coursework. Unlike the traditional transcript, where most courses are titled in terms of their content, these additions often emphasize skills developed in those activities. Other tweaks on the standard transcript have supplemented the abbreviated course titles with some other information or, in the case of electronic transcripts, links to student production or a course website. Our ongoing Course Characteristics Census and Rich Transcript project is aligned with all of these efforts.


Gathering the data – A course inventory
At the time, Fred Cutler, a Political Scientist specializing in survey research, had just stepped into a role as Academic Director of the Faculty of Arts Instructional Support and IT unit. This unit does both learning technology support and IT services and includes learning designers, developers, and data scientists working with a new data warehouse. This was a fortuitious place to start the project because all aspects of the data collection (consultation, survey design, respondent recruitment), as well as the data manipulation and presentation, could be done in one place.
We began with a small team examining how we might best collect the relevant information about each course. The natural place to start was to gather syllabi and code them. That was suggested by the Dean’s Office and Department Heads, presumably because it was thought that syllabi would contain a clear indication of the learning activities and skills to be developed in the class. And because faculty wouldn’t have to be asked to do anything. Asking faculty to do new things, from the top down, is not something that administrators want to do.
The trouble is that in most institutions syllabi are extremely varied, with only some providing the richness of information we sought, especially on learning objectives in terms of skill development. Some were even inaccessable because departments had not been required to, or supported in, archiving syllabi, and some former instructors were unreachable. We believe it is possible to succeed in producing rich transcripts based on coding the information in syllabi, but departments pursuing this option will be constrained by that choice.
We decided to try a different approach to gather wider-ranging and more reliable data. We would ask instructors to provide structured information about each course. The team was advised to pilot this approach in one department. So, in consultation with experts on pedagogy and assessment, and of course the pilot department itself (Political Science), we built an online questionnaire [Link] to gather detailed information on these characteristics of courses: learning outcomes defined as skills, teaching modalities, learning activity structure, assessments, work time expectations, technology use, and special features like community service learning or primary research.
But this was no ordinary internal university survey that would be valuable with, say, a 20 percent response rate. If we were going to be able to aggreate the course information for each student, we would need a 100 percent response rate – i.e. a census, not a survey.
The final questionnaire typically took 20 minutes per instructor per course. Obviously, instructors are not asked to repeat it if they have not significantly changed their course design from year to year. Still, it was a tremendous challenge getting information on every course taught in the department, by full-time and part-time faculty, over the course of four years. We only succeeded (almost fully) because we had the strong participation of the department chair and the project lead was able to twist his colleagues’ arms in a way that only a colleague can do. Even then, we were missing a few courses, particularly those taught by sessional lecturers and post-docs.
A department or Faculty or College trying to gather this information should consider the time lag from beginning to collect the data to when the RT can be issued for the first time. It is theoretically possible to start by trying to gather the data back five years to cover the course history of students about to graduate. It will almost certainly be difficult to get compliance from all instructors of all courses going back that far. In our case, we did it ‘forward’, over the course of four years. Even then, at the end of those four years we had to go back to fill in some missing responses and try to collect data on courses as far back as seven years because currently graduating students had taken time off and some had their first courses seven or more years before graduation.
Lesson 1: To provide rich transcripts to students based on instructor-provided data there must be full buy-in from the department chair to use all methods to ensure that all instructors fill out the questionnaire for all of their courses, over the course of a few years.
Lesson 2: Different strategies are required to ensure participation by different types of instructors. We learned that we had to write a census response requirment into the contract of part-time (sessional) instructors. Full-time faculty had to be told over and over that this was mandatory because without full participation, students would not get a complete rich transcript and any reputational or satisfaction benefit to the department would not be realized.
Manipulating the data – Creating the transcripts
We needed course information for 237 unique course-instructor pairs. That is, if both Prof. Apple and Prof. Plum taught POLI367, we needed data from each of them. But if Prof. Apple taught the course four times we only needed that one data point from her: Apple – POLI367. Our goal was to match that course-instructor data to the enrolment histories of about 550 graduates from the Political Science major.
We began by defining what indicators we wished to include in the Rich Transcript; what were the features of the courses that could be aggregated and would be useful for students. Some of the course data could be taken as is, but most of it required manipulation and aggregation. For example, we decided we wanted to include a “total pages written” indicator but we had asked for page counts for separate assignments and activities in the class (e.g. Writing Assignment 1, Writing Assignment 2, research design, etc.).
Lesson 3: Define what indicators you want to surface for students (and for the program) before composing the questionnaire. Consider how the data will be aggregated and forumulate questions to facilitate easy data processing. For example, if we had asked an additional question about total pages written in the course outside tests and exams, we would have saved ourselves a lot of trouble and imprecise estimates in the aggregated data.
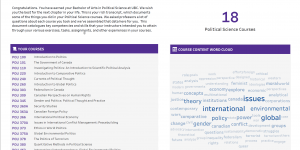
We settled on these items as the content of the rich transcript:
- A list of the student’s courses with the real substantive titles, not the offical calendar titles;
- A word cloud from the course descriptions written by the instructors, not the calendar description;
- A tally of the number of writing assignments, the student’s written output in pages, peer reviews, oral presentations, hours of group work, and the number of some enriched learning activities like a research design, primary field research, community and global service learning, and so on;
- A tally of the number of courses for that student in which 20 different skills were a key learning objective, ranging from common ones like “Write clearly and effectively” to less common ones like “Develop or clarify a personal code of ethics” or “Perform mathematical or formal/logical analysis”.
One piece of course data deserves special mention: the course description written by the instructor for the department website. These were ultimately aggregated within students to create a word cloud from all the text of the course descriptions for the courses that student had taken. We asked instructors to provide this, but in some cases we had to dig up these descriptions from an archived version of the department website. Perhaps this department is unusual in not keeping a good archive of courses taught, by year, including descriptions and syllabi; nevertheless, we stronlgy recommend that academic units put such an archiving system in place using a simple database structure.
With the decisions about content made, we needed to design the final product. The approach was to create an infographic-style document in only two pages. A designer was brought in to work with our data scientist who would be batch-producing the RT in Tableau (a leading data science and data visualization tool). The result is a document that looks official but at the same time engaging, suitable for both print and screen. It is designed to be a document that can be digested in just a minute or two but has enough detail that a student can point to it in a job interview and provide examples of their output, learning activities, and skill development.
The team’s data scientists merged the course and enrolment data and did some of the operations required in R (data manipulation and statistics software). They then exported it from R to Tableau for further aggregation within students. Producing the RT involved a scripted loop within Tableau to spit out a PDF for each student with their name in the filename.
Sending the Rich Transcripts and assessing their value
Using a list of graduates’ names and emails, the local IT team at the UBC Faculty of Arts ISIT unit created a script to send the email as a mailmerge from a department of political science account (rather than a mailing list service like Mailchimp). Because the document is issued by the department it was important that students saw it as coming from an official source with a note from the Head of the department in the body of the email. The only drawback is that we couldn’t track how many of our graduates opened the email or the RT attachment.
We addressed that problem with a followup survey, administered through our campus Qualtrics survey tool. The survey acted as a reminder for students to look at the RT or find it in their spam folder. We asked about the value students saw in the rich transcripts and how they imagined using and sharing it. After a couple of follow ups to our 513 survey invitations we got to 176 responses, a 34% response rate.
All but a handful had opened their Rich Transcript and in fact two thirds had opened and looked at it more than once. The mean overall rating of the value of the transcript was 4.0 on “the usual five star scale”. The rating for “Usefuleness for Career” was slightly lower, however, at 3.4. When asked on a zero to ten scale if they would recommend that other schools and programs offer this to their students, three-quarters gave a response at 7 or above, with 30 percent giving a 10.
About two-thirds of the students had already shown it to friends or family when we followed up with them a few weeks after they first received it. Sixty percent said they thought they were likely to show it to a prospective employer at some point.
We invited comments and got plenty of them, including some excellent suggestions for continuing development of the Rich Transcripts. One of the strongest and most common was to allow students to access the report online as they progress through their degree, so they can see what skills they are accumulating. Some even suggested that the information about learning activities and skills development be available while students are selecting courses so that they can “fill gaps” in their skill set by choosing courses with particular learning activities and outcomes.
The continuing evaluation plan awaits further feedback from students after enough time has elapsed that some may have used the RT as they look for jobs and consider career pathways. We will also reach out to employers to hear about the value of the existing RT document and suggestions for improvement and extension.
Conclusions and future directions
This was obviously an unusually intensive project for one academic department, even if it will impact nearly 300 graduates per year. Our estimate is that from start to finish, the project took 400 hours of work by the project team. And then there is the 20 minutes per response for 270 instructor-courses, or another 90 hours. It is hard to say if the value of the RT for 550 students over two graduating years is greater than the total project cost. However, as a proof-of-concept and development of a process for generating rich transcripts in any department, we believe the investment will pay dividends.
In the short term the team will consolidate the work done in Political Science by streamlining the data gathering and production processes. We will also work to integrate the process and the rich transcripts with efforts to support students and alumni in career preparation and job search, for example with the development of sample resumés and a guide to the interpretation and presentation of the information contained in the rich transcripts.
During this consolidation phase, we will elaborate a process framework, providing a ‘kit’ that can be used by any department that wishes to do a course characteristics census and produce rich transcripts. The process phases will be, roughly:
- Definition of desired rich transcript content
- Development of the instructor questionnaire through consultation
- Questionnaire administration, including timing
- Data manipulation
- Joining course data to student enrollment data
- Rich transcript visual/graphic design
- Production of rich transcripts
- Distribution
- Integration with student and alumni career resources
- Evaluation
In the longer term, it should be possible to: first, issue the rich transcript at the end of each semester, so students can track their learning experiences and skills development; and second, make the course census information available to students as they choose their courses. Students could then more consciously and accurately build their own program to acquire and develop a wide range of skills and perhaps deep competency with one or two.
We would appreciate comments and feedback.
This really opened my eyes to how hard it is to innovate in higher education. You would think that every department and every Faculty and every University should know what students are doing in courses. But most don't! It wasn't easy to get professors to fill out a questionnaire reporting how their course is designed and what students do and produce.
Manipulating the data and producing the RT was the easy part! It wasn't technically _easy_ but it was easier than the other parts of the project.